Take a look at the below table and its configuration that follows.
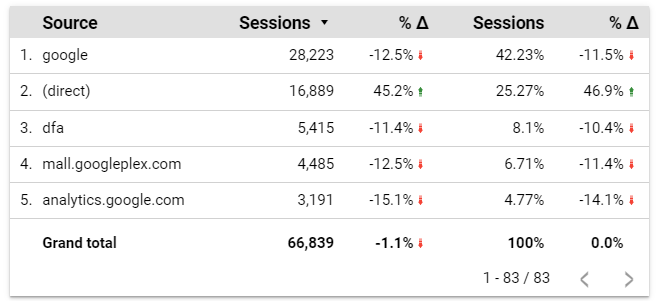
The dimension is ‘source’. The metric ‘Sessions’ is added twice. You will generally not need to add it twice. But I am doing so in this post to make it easy to explain the difference between the two options. See image below
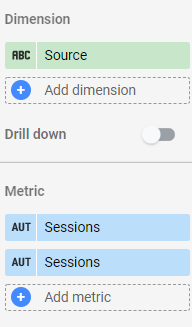
The first metric ‘Sessions’ uses the default settings.
The second ‘Sessions’ metric uses ‘Percent’ as the type. ‘Percent of total’ is the ‘comparison calculation’. In ‘Percent of total’, you have two options: 1) ‘Relative to base data’ and 2) ‘Relative to corresponding data’. I will explain these two options in detail, later in the post.
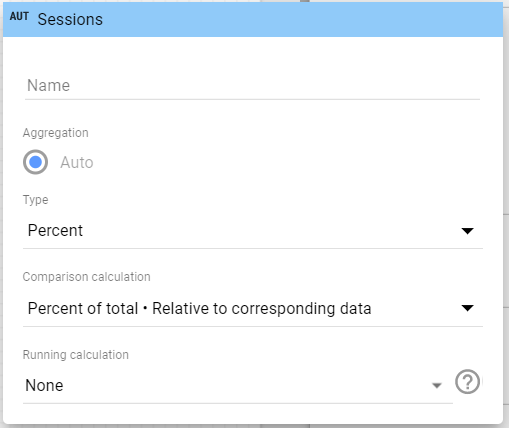
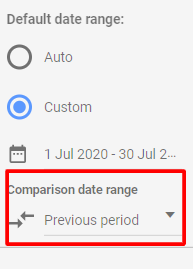
It uses ‘Previous period’ as the ‘comparison date range’. Note that ‘Relative to base data’ and ‘Relative to corresponding data’ are relevant only when you choose a corresponding date range.
I. Percent of total – Relative to base data:
Relative to base data shows you the percentage by which the absolute numbers have changed compared to the previous period.
The below two tables use the comparison calculation: Percent of total – Relative to base data. One table shows data for the 30 day date range ‘1st July 2020 to 30th July 2020’. The second table shows the previous 30 day date range ‘1st June 2020 to 30th June 2020’.
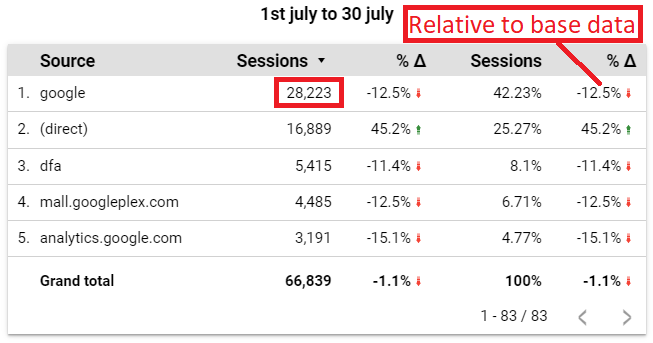
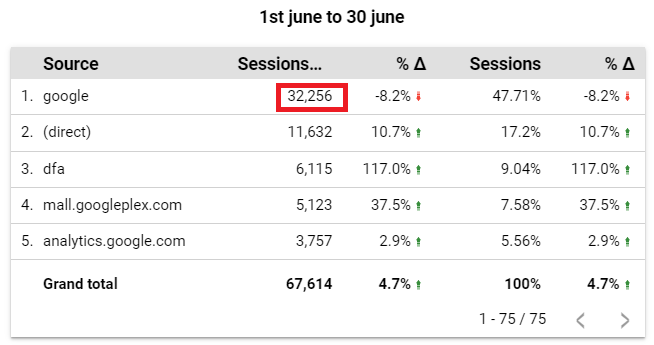
You can see that the sessions from ‘google’ for the 30 day period 1st July 2020 to 30th July 2020 is 28,223. In it’s previous 30 day period (1st June 2020 to 30th June 2020), there were 32,256 sessions. You can calculate the percentage of change using the formula [(28223 – 32256)/32256]*100. So the percent of total – Relative to base data is -12.5%.
II. Percent of total – Relative to corresponding data:
Relative to corresponding data shows you the percentage difference in a dimension value’s ‘percent of total’.
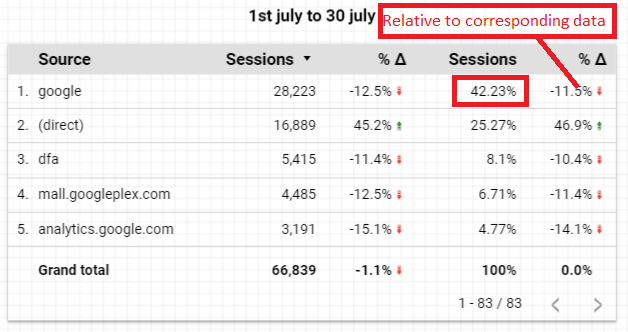
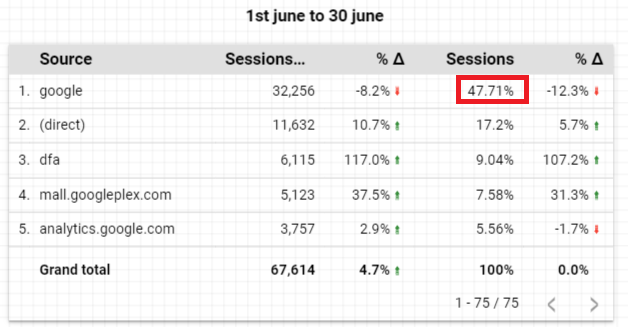
Sessions from ‘google’ were 42.23% of the total sessions for the period 1st July 2020 to 30th July 2020. In it’s previous 30 day period, it was 47.71%. To calculate by how much percent has the ‘percent of total’ has changed, use the formula [(42.23-47.71)/47.71]*100. So the Percent of total – Relative to corresponding data is -11.48% (rounded to -11.5%).
I hope you found this post helpful.