If you want a custom Looker studio report built by a professional, you can hire me here.
Let us have a look at the icons used in this template before we begin to explore the report.
Optional metrics (![]() )
)
Click the icon to see optional metrics that you can add to the report. Click the reset button (![]() ) to take it back to the original state.
) to take it back to the original state.
Interactive charts (![]() )
)
This is not an inbuilt icon in Looker Studio. I have made this icon to identifiy interactive charts.
In a time-series chart, you can drag along the date axis to select a date range. The entire report is filtered to show data for that date range. You can reset it by clicking the reset button  .
.
You can also use a bar chart dimensions to filter the report. If you click on organic search in this bar chart, the whole page will be filtered by organic search. You can reset it by clicking the reset button .
Let’s explore the template and try some customization exercises. The customization exercises will help you get familiar with Looker Studio features.
Page 1: Overview
A) Filters: When you open a filter, you can see ‘goal completions’ for each of the dimension values.
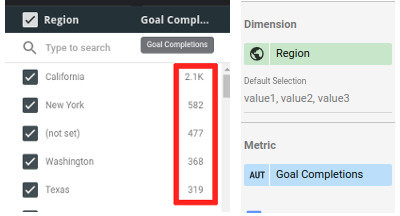
Edit the report and select a different metric to suit your requirements. For example select ‘Goal 1 completions’ as the metric.
B) Time series chart

This time series chart has sessions, users and goal completions as the default metrics and others as otpional metrics.
Make users an optional metric by dragging it from ‘metrics’ to the ‘optional metrics’ section.
C) Table chart with conditional formatting

In this table, if ‘Puchase completed (Goal 1 conversion rate)’ is less than 0.15%, it is filled with red color.
Change conditional formatting rule from 0.15% to 0.25%
Edit the report
Select the table and go to the ‘Style’ tab
Edit the ‘Conditional formatting’ rule

To change it from 0.15% to 0.25%, change it to 0.0025 (0.25 divided by 100)
Page 2: Acquisition
A) Conditional formatting: None of the tables in this page have conditional formatting.
Add a conditional formatting rule to each of the tables here. For example, fill the cell with red color when ‘Goal conversion rate” < 10%
B) Sort order: Tables are sorted by descending order of sessions.
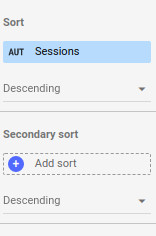
Go to the ‘Data’ tab and sort a table by the descending order of ‘Goal completions’. Also add a ‘secondary sort’ by the descending order of ‘Enagaged users (Goal 2 conversion rate)’.
Page 3: Behavior
Try the same customization ideas mentioned for page 2.
Page 4: Geo and Demographics
The geo map shows metrics for each country. The map’s zoom area is ‘world’

1) Change the dimension to city.
2) Change the zoom area to a country of your choice.
Page 5: Miscellaneous
A) Bar chart: No. Of Sessions vs Users and Goal 2 completions

In this image you can see that there were 39,958 users with ‘Count of sessions’=1. Also 3205 goal completions were done by users with ‘Count of sessions’=1. This chart has a calculated field ‘No of sessions’ that converts the count of sessions into four intervals: ‘1’, ‘2 or 3’, ‘4 to 9’ and ‘10 & above’.
The formula used is given below. It is quite intuitive. I invite you to edit this formula (click ‘fx’ shown in the image to edit formula) to create your own session slabs.
CASE
WHEN Count of Sessions IN(‘1’) THEN ‘1’
WHEN Count of Sessions IN(‘2′,’3’) THEN ‘2 or 3’
WHEN Count of Sessions IN(‘4′,’5′,’6′,’7′,’8′,’9’) THEN ‘4 to 9’
WHEN Count of Sessions>’9′ THEN ’10 & above’
ELSE ‘Others’
END