In this post, I will share a few ideas and Looker Studio features to help Digital Agencies with multiple clients. The idea is to start a discussion around this topic and share notes among ourselves.
1. Create a master report
2. Chart specific vs Data Source calculated fields: Which ones to use?
3. Give descriptive names to data sources
4. Copy existing data source instead of creating new ones
5. Remove unused data sources
6. Remove unused filters in a report
7. Remove unused ‘blended data’
8. Use ‘Extract theme from image’ to incorporate brand colors
9. Client logo and Agency logo in the report
10. Use ‘data control’ for your agency dashboard
11. Use embedded data sources where possible instead of reusable ones
1. Create a master report
The master report should contain the most commonly used charts and score cards. You can copy this report for a client and make necessary customizations. Begin with sample data sets provided by Looker Studio like Google Analytics, Google Ads. Visit the Looker Studio gallery for inspiration.
Do not experiment too much with colors as clients may want their reports to be customized with their brand colors.
Prepare a check list of tasks for customizing the report. For example: change logo, change domain name in a custom field, change geographic selection in a geo chart.
Do you need help in creating Looker Studio Reports? I am Sasi. I am a Looker Studio freelancer. See my Looker Studio offerings here.
2. Chart specific vs Data Source calculated fields: Which ones to use?
See the below page to know the difference between chart specific and data source calculated fields
https://support.google.com/datastudio/answer/6299685?hl=en
a) Use chart-specific calculated fields in master report. When you copy the report, chart-specific calculated fields get copied to the new report while data source – calculated fields do not get copied.
Because chart-specific calculated fields have to be created for each individual chart, they take more time. But you will save time in the long run.
b) If you are making some charts for a client which may not be required by other clients, you can use data source calculated fields if required. If the field will be used in multiple charts, use data source calculated field. Otherwise, use chart-specific fields.
3. Give descriptive names to data sources
In the absence of a directory structure to organize data sources, giving descriptive names will make locating a data source easier. I generally include the client/property name, data connector name and report type (if using SEMrush). Below are a few examples of data source names:
DataSasi – Google Analytics
DataSasi – Google Ads
ClientName: Organic Positions – Position tracking – SEM Rush
ClientName: Organic Overview – Position tracking – SEM Rush
ClientName: Organic Search Positions – Domain Analytics – SEM Rush
ClientName: CompetitorsName- Organic Visibility – Position tracking – SEM Rush
ClientName: Organic Visibility – Position tracking – SEM Rush
ClientName will be replaced by actual client name in the above.
4. Copy existing data source instead of creating new ones.
Some data connectors like SEMrush may require complex configurations. Instead of going through the process of creating a new one for every client, you can copy an existing data source and make small changes like Account id/View id.
To copy a data source:

- Click the copy button on the top-right
- Make the required configuration changes that the data connector requires (examples: select a new view, enter a new account id)
- Change the data source name (it begins with ‘copy of’) at the top-left of the screen
- Click ‘Reconnect’
- If Looker Studio shows you a list of new fields or missing fields, review them and click ‘Apply’.
- Click the Looker Studio logo on the top-left of the screen. This will take you back to the data sources list.
If you were unable to change the data source name in the above steps for some reason, you can do so from the data sources tab.
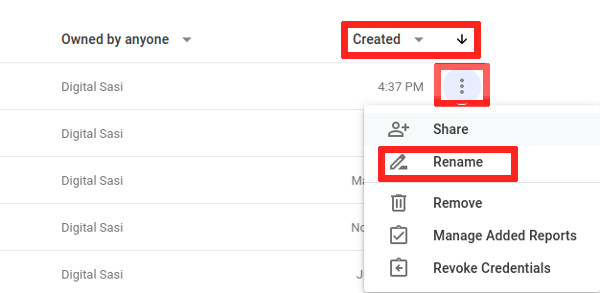
- Sort the list by ‘Created’
- Click the more options icon.
- Click ‘Rename’ and give it a new name.
5. Remove unused data sources
If you have many clients, you would have created data sources that have never been used or no more used. Remove unused data sources so that you reduce the chances of selecting a wrong data source accidentally while creating a report. Follow the below steps to identify and remove unused data sources:
- Login to lookerstudio.google.com
- Click the ‘Data sources’ tab
- Open the more options menu (3 dot menu) for any data source in the list.
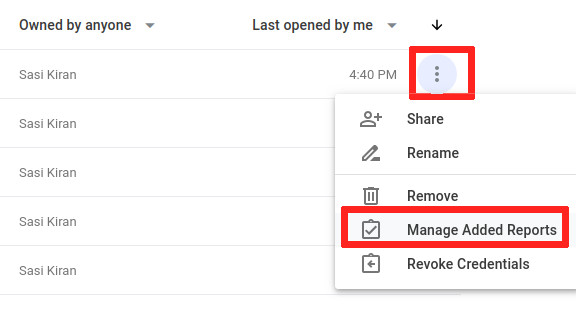
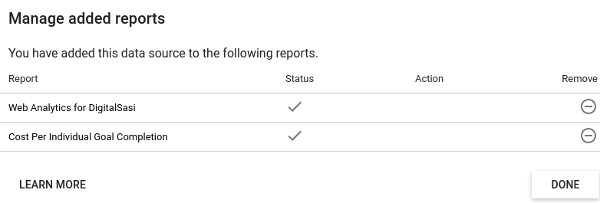
- Click ‘Manage Added Reports
- This will show you the list of reports that the data source is added to. If it is added to no reports, you will see the message “You have not added this data source to any report”.
6. Remove unused filters in a report
Some reports are constantly evolving. You continuosly experiment and try out new stuff. This can result in a large list of unused filters making it tough to find the right filter for a chart. And when you copy this report for another client, all these unused filters are also copied. If you have a continuously evolving report, find and remove those unused filters.
- ‘Edit’ the report
- Go to Resource >> Manager filters. This will show you the list of all filters created for this report.
- Remove the filter that is used in ‘0 charts’.
7. Remove unused ‘blended data’
This is again an issue with constantly evolving reports. You might end up with a bunch of blended data that you have never used. When you copy this report for a new client, all the blended data including the unused ones get copied.
- ‘Edit’ the report
- Go to Resource >> Manage blended data. This will show you the list of all blended data created for this report.
- Remove the blended data that is used in ‘0 charts’.
8. Use ‘Extract theme from image’ to incorporate brand colors
To incorporate your client’s brand colors in the report, use Looker Studio’s ‘Extract theme from image’. You can extract theme from the client’s logo, website screenshot or any other image that has their brand colors. Use this theme as a starting point and customize further.
To extract theme from an image:
- ‘Edit’ the report
- Towards the bottom of the ‘Theme and Layout’ panel, click ‘Extract theme from image’
- Upload an image from the computer or enter the image url.
- Looker Studio will give you a list of themes. Select a theme that you like. This theme will be applied to the report.
9. Client logo and Agency logo in the report
Should you use your client’s logo in the report? That is a design decision. There is no right or wrong answer.
Argument: Ideally, there should be no logo since a report is not a marketing tool. A logo on the top pushes the actual report down increasing the vertical scroll.
Counter argument: We are an agency and clients love it when we put their logo on the report.
Should you put your agency’s logo on the report? Again, there is no right or wrong anser. You can put your logo or company name at the footer area.
10. Use ‘data control’ for your agency dashboard
You can create an agency dashboard that monitors the most important metrics for each of your client. Build this dashboard to monitor just one client and then use the ‘data control’ feature to monitor those metrics for all clients. Data control gives you a drop down selector in the report, which can be used to select a data set. Metrics will be displayed based on which client’s data set you select.
More information about ‘data control’ here
https://support.google.com/datastudio/answer/7415591?hl=en
Data control currently supports these data sets:
Google Ads
Attribution 360 (TV Attribution)
Google Ad Manager
Campaign Manager
Google Analytics
Search Console
YouTube
11. Use embedded data sources where possible instead of reusable ones.
When the ownership of a report is transferred to the client, its embedded data sources are also transferred. Each data source does not need to be transferred individually like the reusable ones. This saves time if the report uses many data sources.
Those were my tips. Do you have any queries? How do you manage your reports in Looker Studio? I would love to hear your ideas and feedback.